x=rnorm(50) # Generate a vector of 50 numbers using the rnorm() functiony=x+rnorm(50,mean=50,sd=.1) # What does rnorm(50,mean=50,sd=.1) generate?cor(x,y) # Correlation of x and y
[1] 0.9960803
set.seed(1303) # Set the seed for Random Number Generator (RNG) to generate values that are reproducible.rnorm(50)
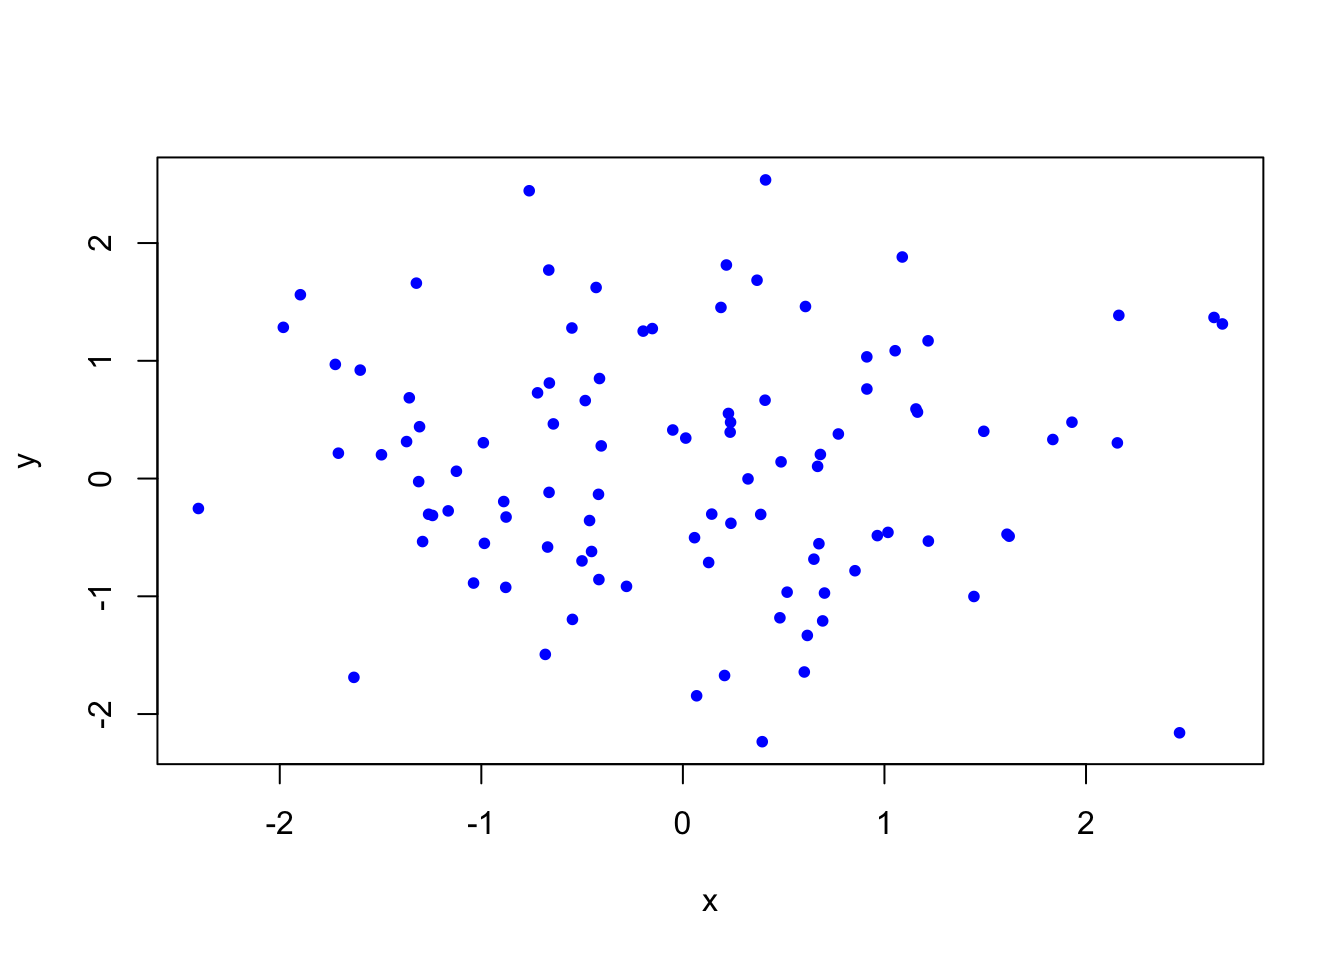
x=rnorm(100)y=rnorm(100)plot(x,y, pch=20, col ="blue") # Scatterplot for two numeric variables by default
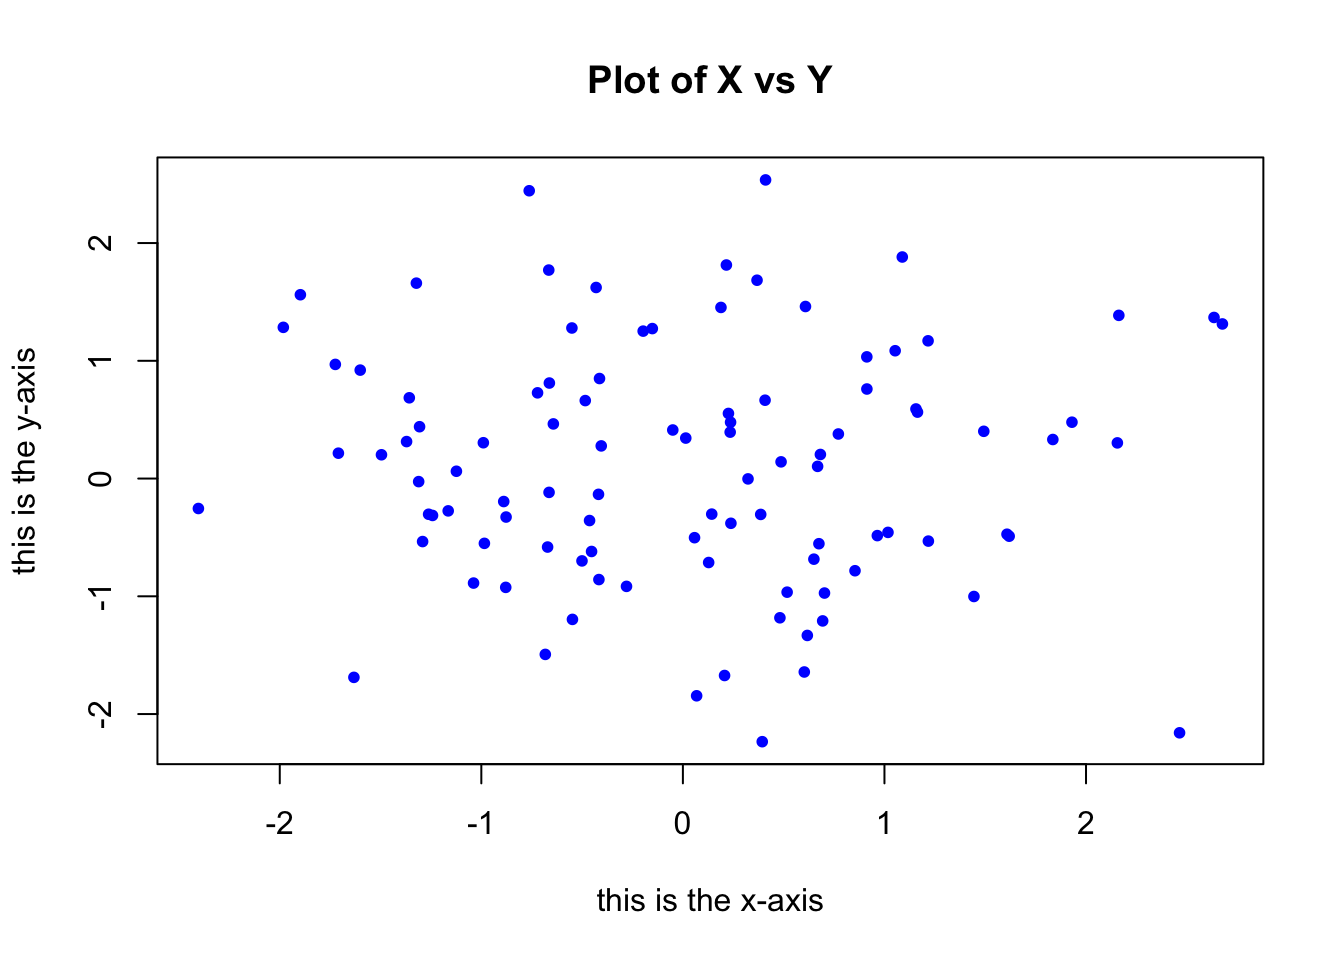
plot(x,y, pch=20, col ="blue",xlab="this is the x-axis",ylab="this is the y-axis",main="Plot of X vs Y") # Add labels
pdf("Figure01.pdf") # Save as pdf, add a path or it will be stored on the project directoryplot(x,y,pch=20, col="forestgreen") # Try different colors?dev.off() # Close the file using the dev.off function