Select only relevant variables to create a subset of the dataset (Tondu, female, DPP, age, income, edu, Taiwanese and Econ_worse). Make sure the dependent variable Tondu is coded with right labels:
#creating a subsetsubset_ <-subset(TEDS_2016, select =c("Tondu", "female", "DPP", "age", "income", "edu", "Taiwanese", "Econ_worse"))#makes sure dependent variable is coded witht the right labels TEDS_2016$Tondu<-as.numeric(TEDS_2016$Tondu,labels=c("Unification now”, “Status quo, unif. in future”, “Status quo, decide later", "Status quo forever", "Status quo, indep. in future", "Independence now”, “No response"))
Run a regplot on the dependent variable using age, education and, income.
modl <-lm(Tondu ~ age + edu + income, subset_)summary(modl)
Call:
lm(formula = Tondu ~ age + edu + income, data = subset_)

Residuals:
    Min      1Q  Median      3Q     Max
-3.7780 -1.1841 -0.4322  1.1079  5.4157

Coefficients:
             Estimate Std. Error t value Pr(>|t|)
(Intercept)  5.302529   0.257369  20.603  < 2e-16 ***
age         -0.004205   0.003194  -1.316   0.1882
edu         -0.244608   0.037579  -6.509 9.96e-11 ***
income      -0.031855   0.016357  -1.948   0.0516 .
---
Signif. codes:  0 '***' 0.001 '**' 0.01 '*' 0.05 '.' 0.1 ' ' 1

Residual standard error: 1.725 on 1676 degrees of freedom
  (10 observations deleted due to missingness)
Multiple R-squared:  0.04287,   Adjusted R-squared:  0.04115
F-statistic: 25.02 on 3 and 1676 DF,  p-value: 7.771e-16
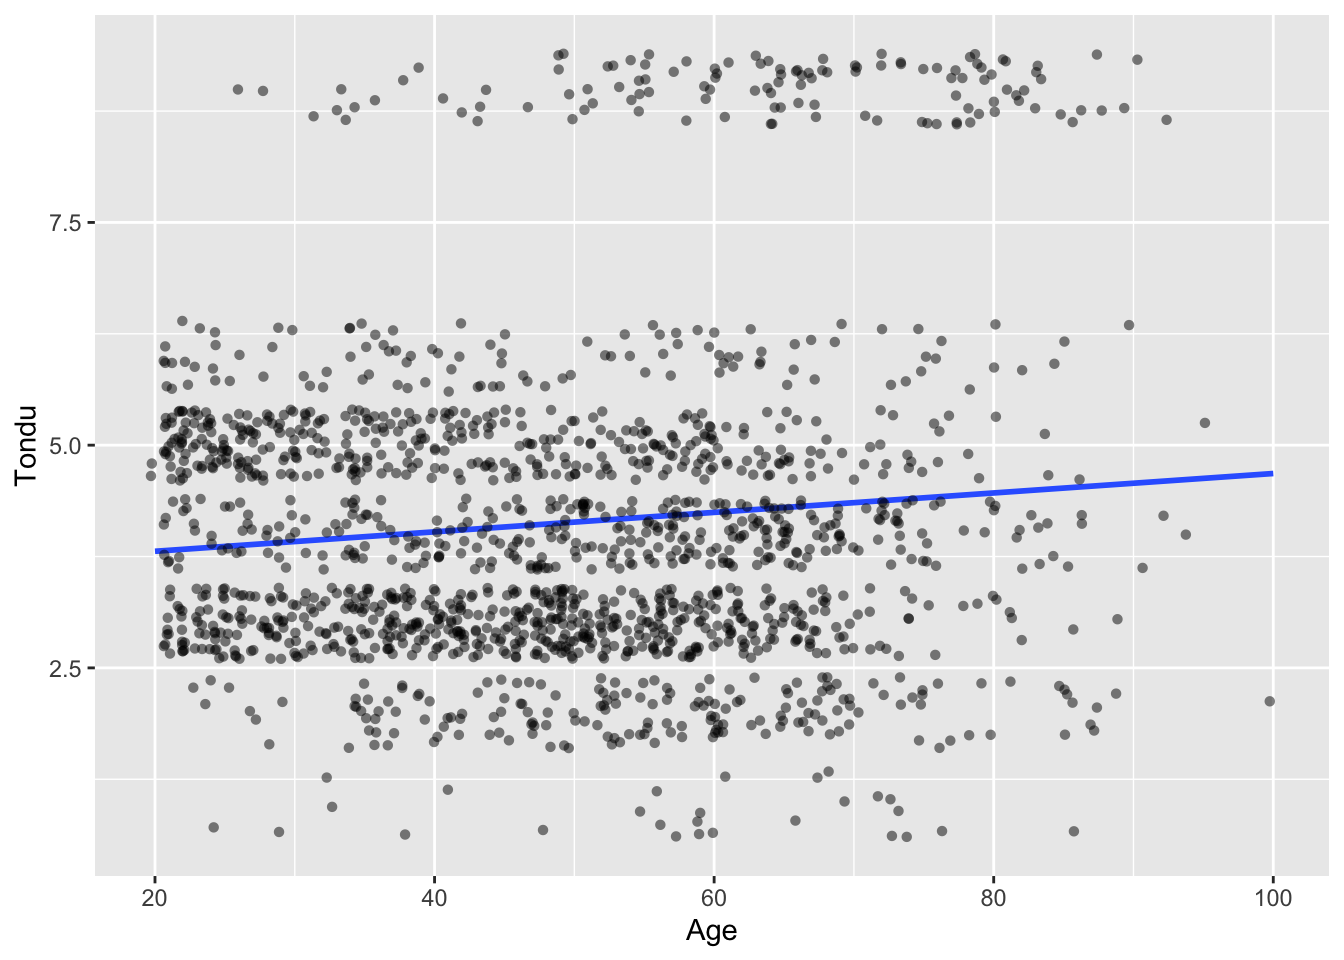
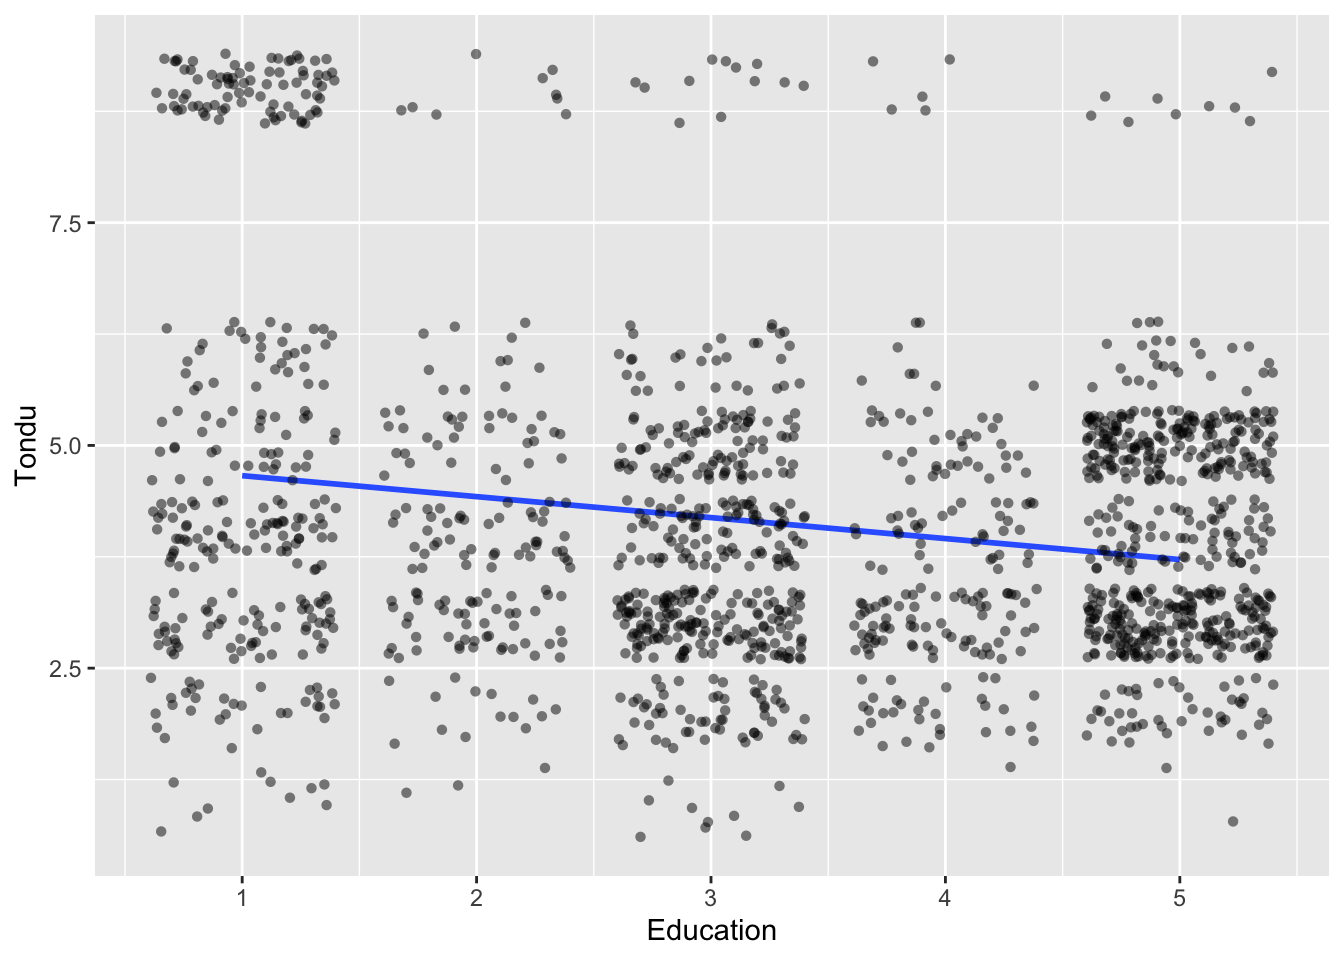
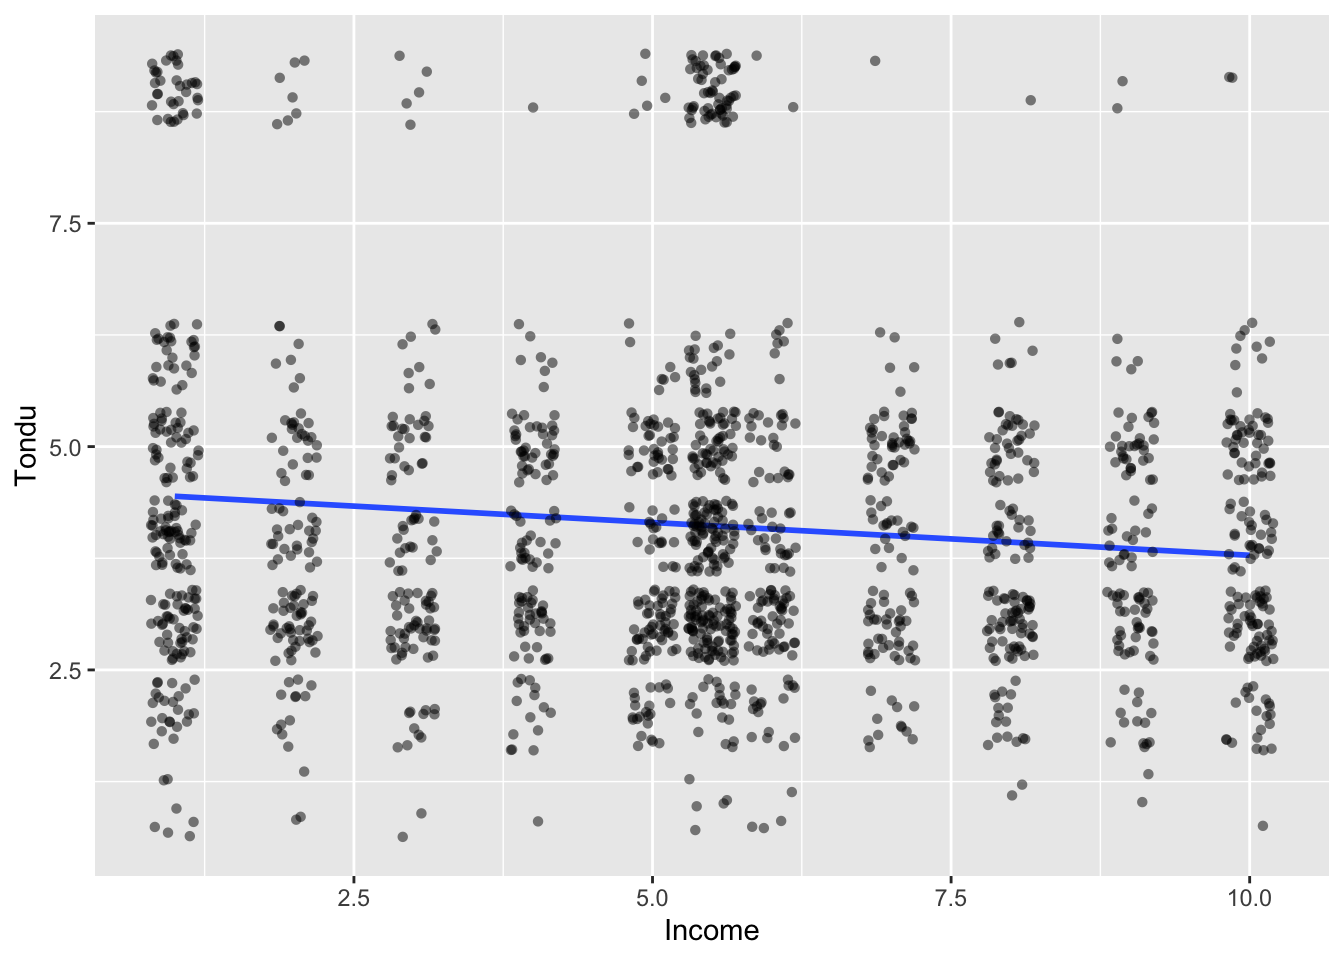
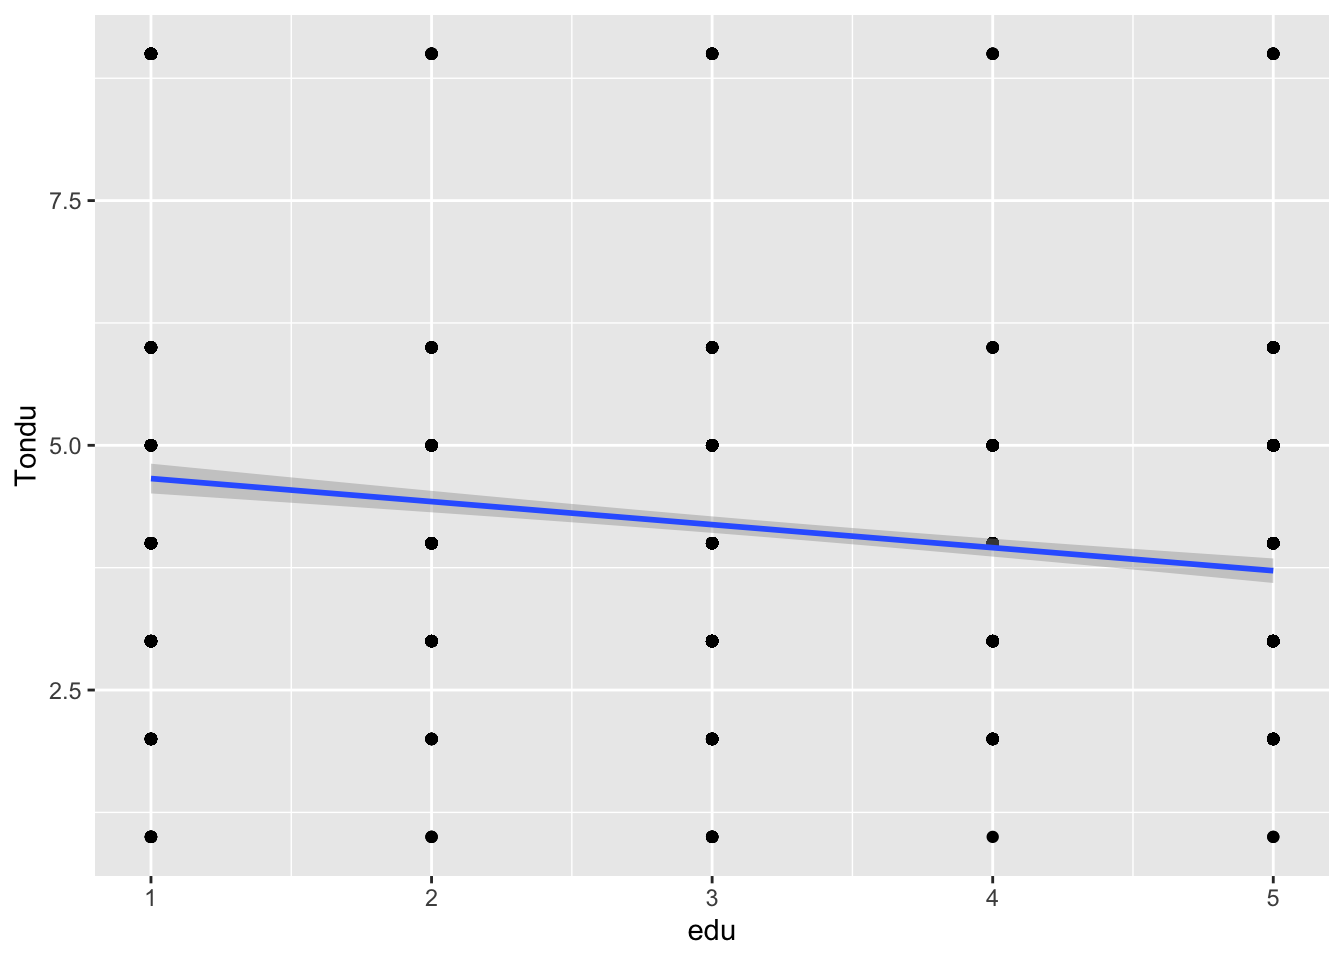
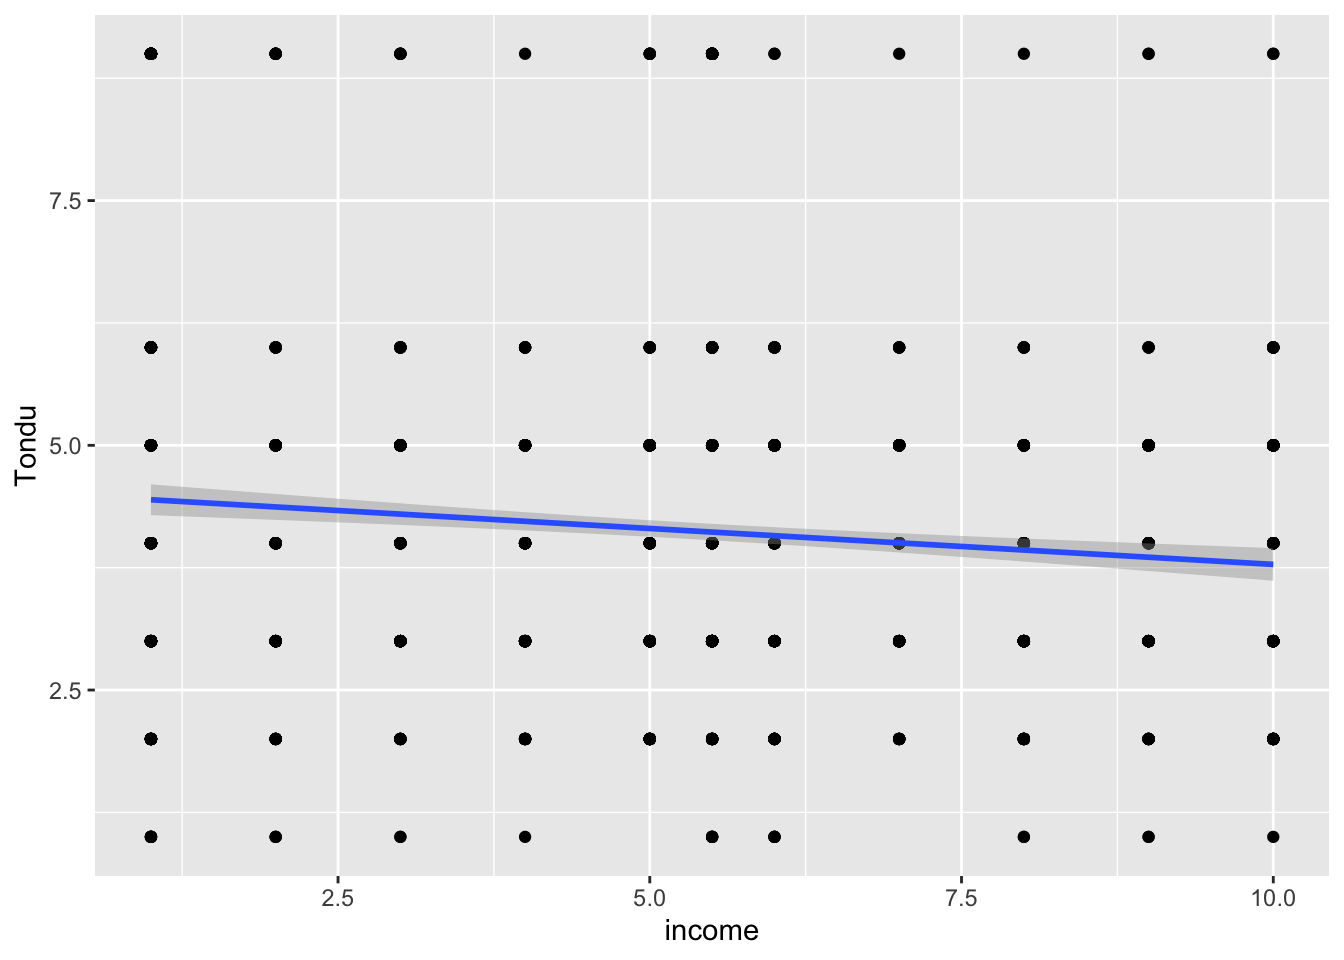
age_t <-ggplot(subset_, aes(x=age,y=Tondu)) +geom_smooth(method ="lm", se = F, show.legend = F, formula = y ~ x) +geom_point(show.legend = F, position ="jitter", alpha=.5, pch=16) +labs(x="Age", y="Tondu")edu_t <-ggplot(subset_, aes(x=edu,y=Tondu)) +geom_smooth(method ="lm", se = F, show.legend = F, formula = y ~ x) +geom_point(show.legend = F, position ="jitter", alpha=.5, pch=16) +labs(x="Education", y="Tondu")income_t <-ggplot(subset_, aes(x=income,y=Tondu)) +geom_smooth(method ="lm", se = F, show.legend = F, formula = y ~ x) +geom_point(show.legend = F, position ="jitter", alpha=.5, pch=16) +labs(x="Income", y="Tondu")suppressWarnings(print(age_t))
Don't know how to automatically pick scale for object of type
<haven_labelled/vctrs_vctr/double>. Defaulting to continuous.
suppressWarnings(print(edu_t))
Don't know how to automatically pick scale for object of type
<haven_labelled/vctrs_vctr/double>. Defaulting to continuous.
suppressWarnings(print(income_t))
Don't know how to automatically pick scale for object of type
<haven_labelled/vctrs_vctr/double>. Defaulting to continuous.
unique(subset_$Tondu)
<labelled<double>[7]>: Position on unification and independence
[1] 3 5 9 4 6 2 1

Labels:
 value                                                              label
     1                                              Immediate unification
     2                    Maintain the status quo,move toward unification
     3 Maintain the status quo, decide either unification or independence
     4                                    Maintain the status quo forever
     5                   Maintain the status quo,move toward independence
     6                                             Immediate independence
     9                                                        Nonresponse
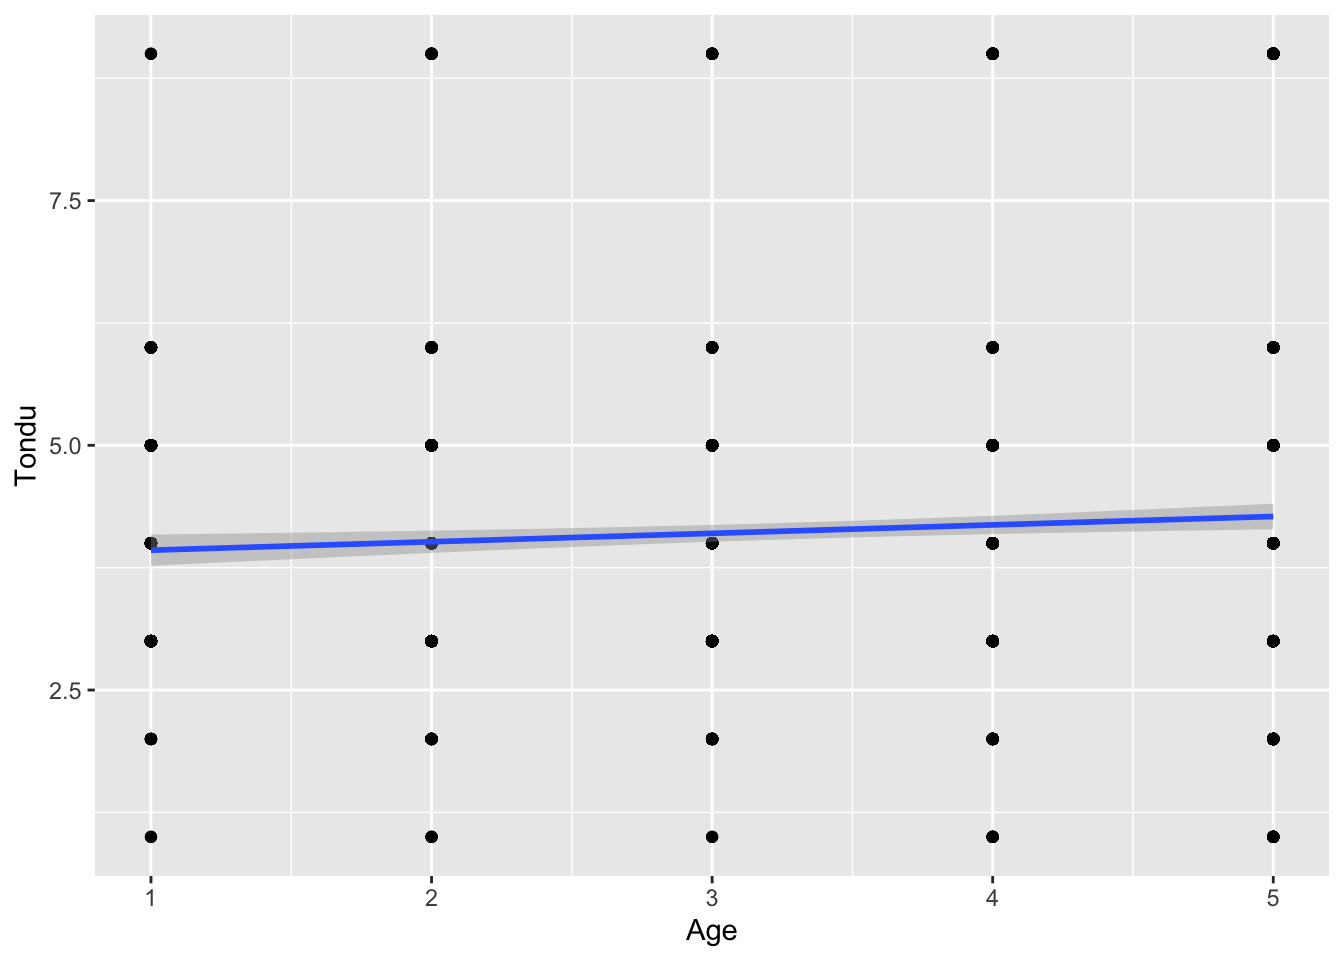
The problem here is that the dependent variable has 7 categories. A lin regression analysis is meant for only one dependent variable which is why the graphs look like such. A better multivariate analysis method could make more sense of this such as a multinomial logistic regression.
attach(TEDS_2016)modl <-lm(Tondu ~ female + DPP + age + income+ edu + Taiwanese + Econ_worse)summary (modl)
Call:
lm(formula = Tondu ~ female + DPP + age + income + edu + Taiwanese +
    Econ_worse)

Residuals:
    Min      1Q  Median      3Q     Max
-4.0523 -1.1411 -0.2287  0.7986  6.1354

Coefficients:
             Estimate Std. Error t value Pr(>|t|)
(Intercept)  4.204138   0.274188  15.333  < 2e-16 ***
female       0.368598   0.082680   4.458 8.82e-06 ***
DPP          0.121223   0.091598   1.323    0.186
age          0.001668   0.003143   0.531    0.596
income      -0.025558   0.015862  -1.611    0.107
edu         -0.181096   0.036824  -4.918 9.61e-07 ***
Taiwanese    0.768943   0.091437   8.410  < 2e-16 ***
Econ_worse  -0.248545   0.083640  -2.972    0.003 **
---
Signif. codes:  0 '***' 0.001 '**' 0.01 '*' 0.05 '.' 0.1 ' ' 1

Residual standard error: 1.667 on 1672 degrees of freedom
  (10 observations deleted due to missingness)
Multiple R-squared:  0.1074,    Adjusted R-squared:  0.1036
F-statistic: 28.73 on 7 and 1672 DF,  p-value: < 2.2e-16
Don't know how to automatically pick scale for object of type
<haven_labelled/vctrs_vctr/double>. Defaulting to continuous.
`geom_smooth()` using formula = 'y ~ x'
ggplot(subset, aes(x = edu, y = Tondu)) +geom_point() +geom_smooth(method ="lm")