The downloaded binary packages are in
    /var/folders/fg/l9nwkw5954b_7xv794xmt5_40000gn/T//Rtmps4QTUQ/downloaded_packages
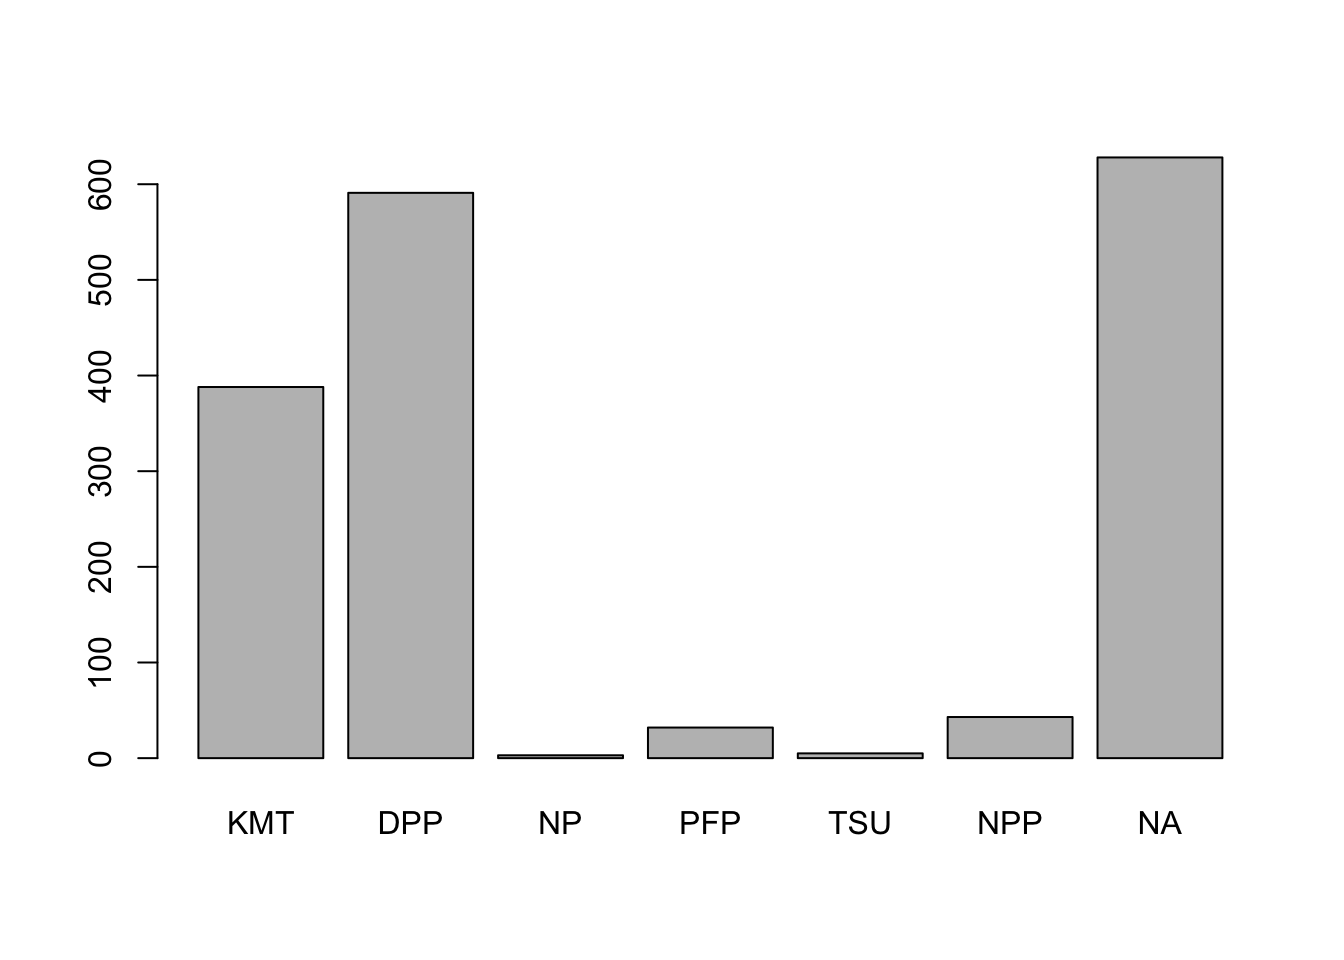
library(descr)freq(TEDS_2016$PartyID)
TEDS_2016$PartyID
Frequency Percent
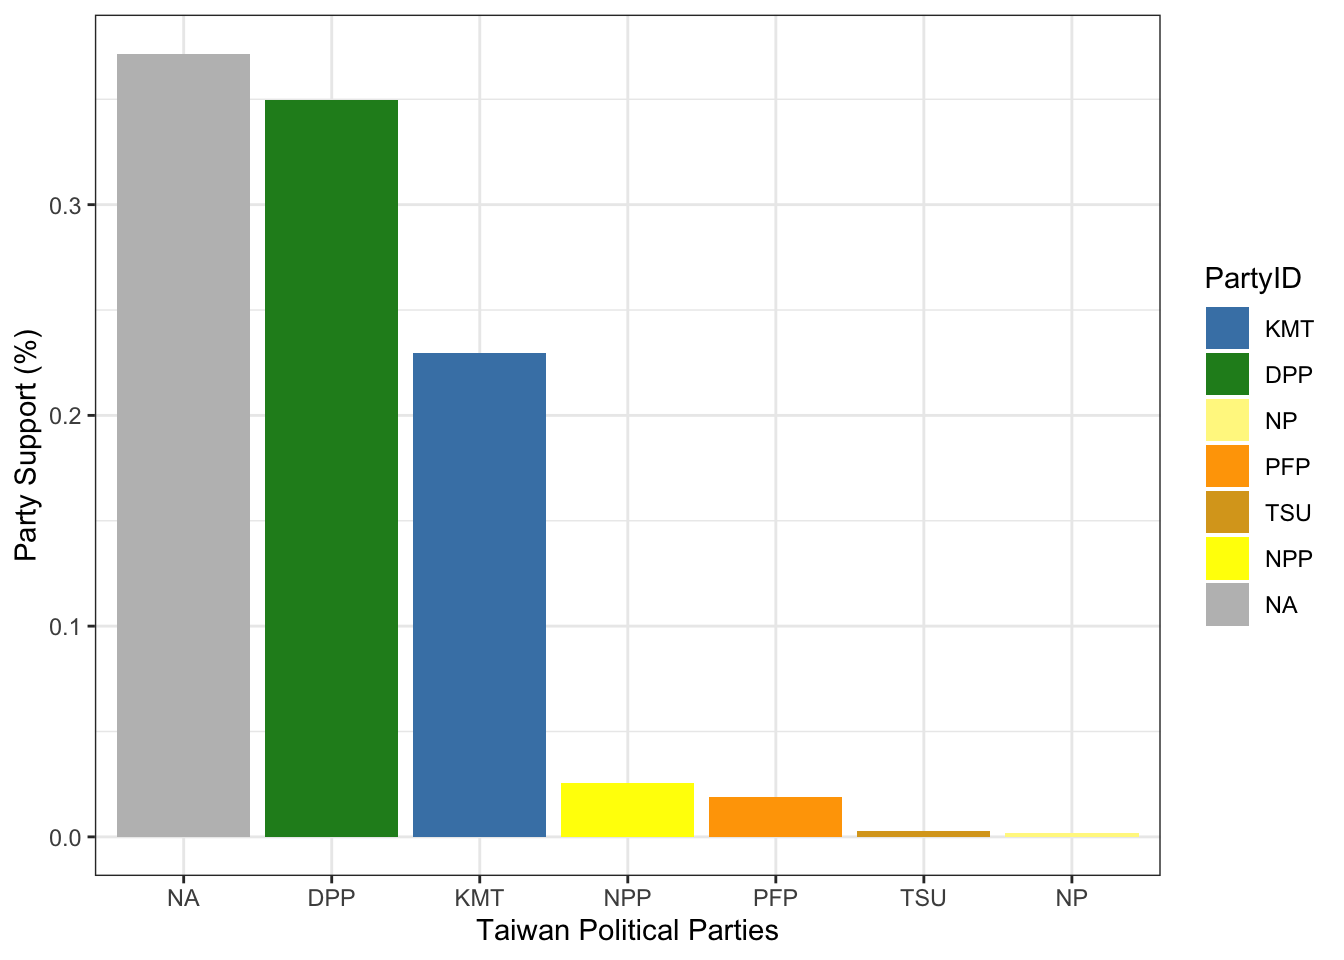
KMT 388 22.9586
DPP 591 34.9704
NP 3 0.1775
PFP 32 1.8935
TSU 5 0.2959
NPP 43 2.5444
NA 628 37.1598
Total 1690 100.0000
# Plot the Party ID variablelibrary(ggplot2)
ggplot(TEDS_2016, aes(PartyID)) +geom_bar()
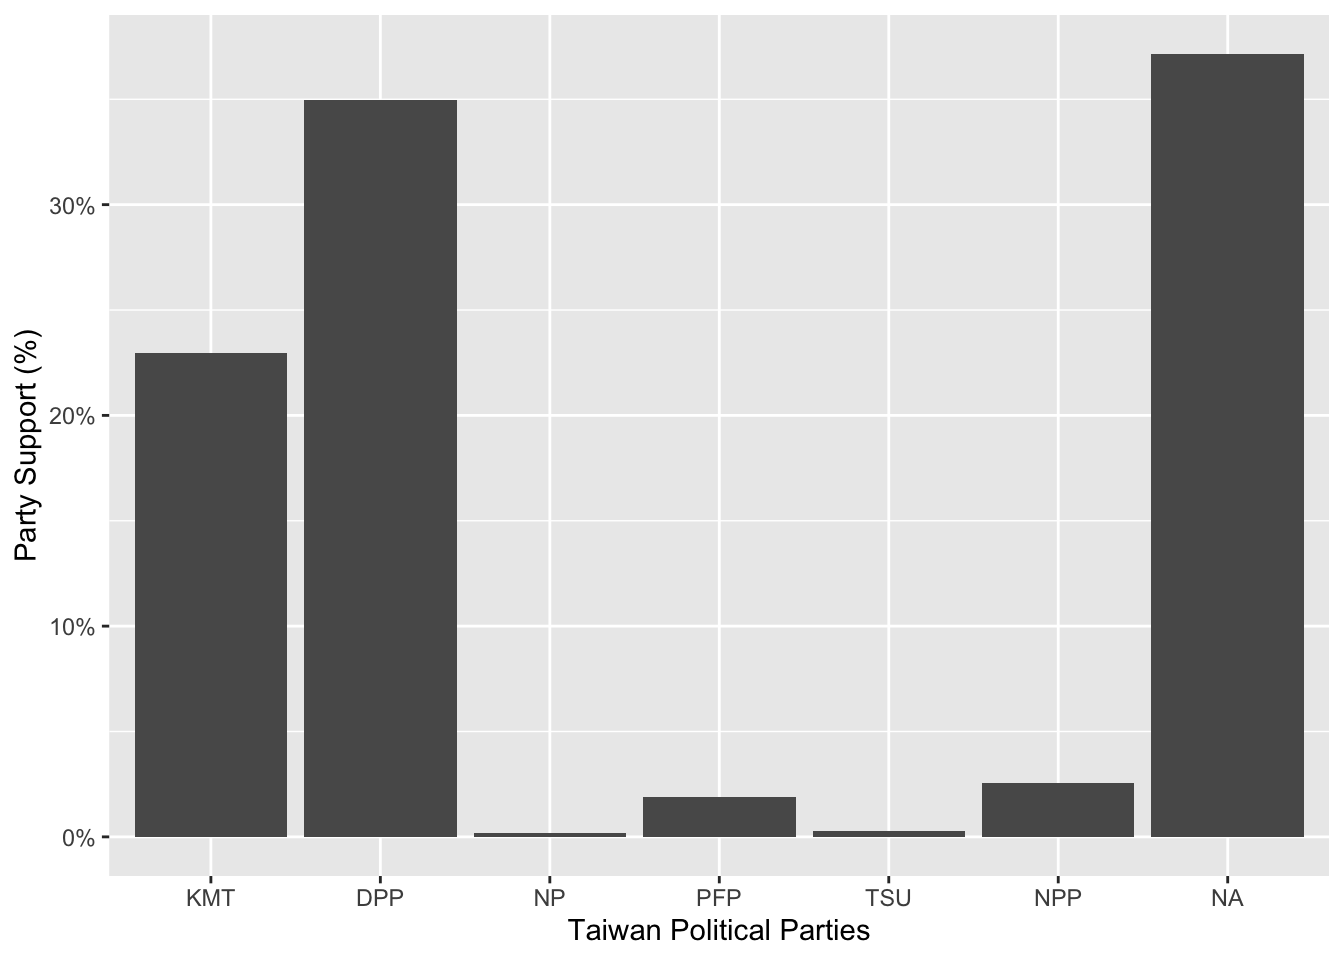
ggplot(TEDS_2016, aes(PartyID)) +geom_bar(aes(y = (..count..)/sum(..count..))) +scale_y_continuous(labels=scales::percent) +ylab("Party Support (%)") +xlab("Taiwan Political Parties")
Warning: The dot-dot notation (`..count..`) was deprecated in ggplot2 3.4.0.
ℹ Please use `after_stat(count)` instead.
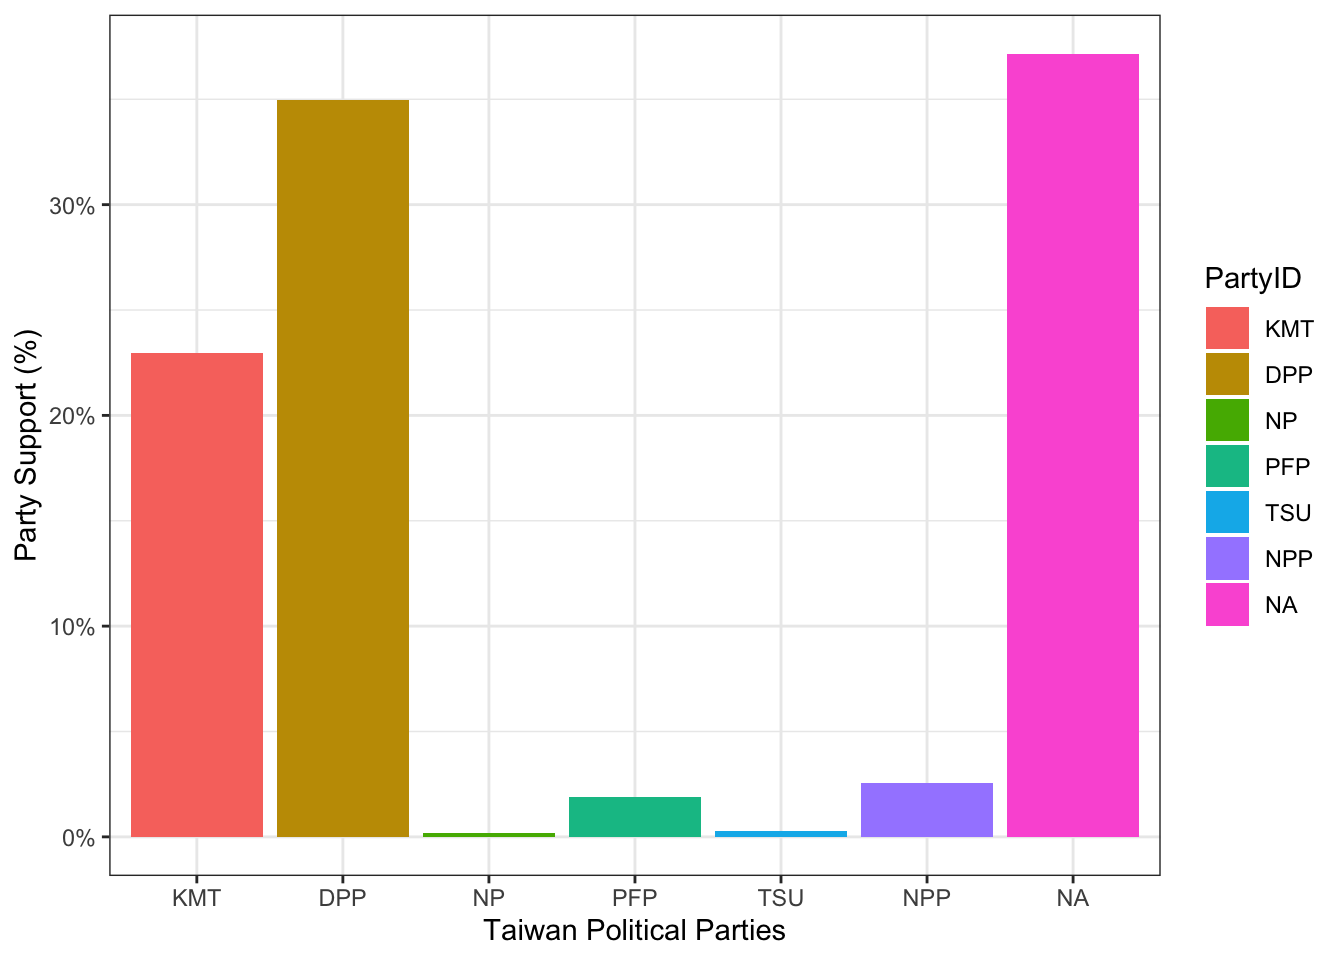
ggplot(TEDS_2016, aes(PartyID)) +geom_bar(aes(y = (..count..)/sum(..count..),fill=PartyID)) +scale_y_continuous(labels=scales::percent) +ylab("Party Support (%)") +xlab("Taiwan Political Parties") +theme_bw()
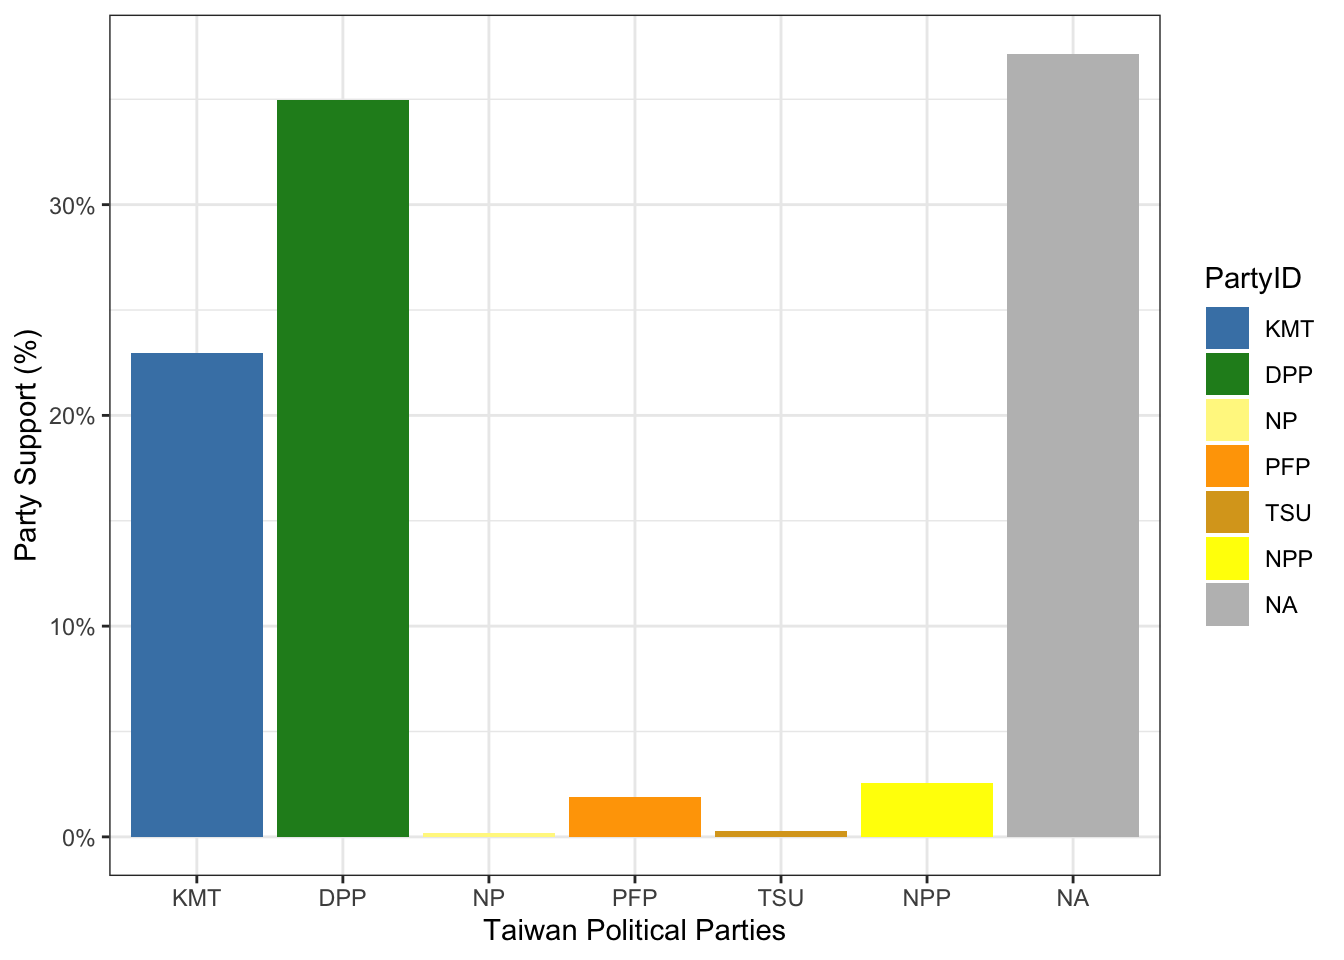
ggplot(TEDS_2016, aes(PartyID)) +geom_bar(aes(y = (..count..)/sum(..count..),fill=PartyID)) +scale_y_continuous(labels=scales::percent) +ylab("Party Support (%)") +xlab("Taiwan Political Parties") +theme_bw() +scale_fill_manual(values=c("steel blue","forestgreen","khaki1","orange","goldenrod","yellow","grey"))
library(tidyverse)
── Attaching core tidyverse packages ──────────────────────── tidyverse 2.0.0 ──
✔ dplyr     1.1.0     ✔ readr     2.1.4
✔ forcats   1.0.0     ✔ stringr   1.5.0
✔ lubridate 1.9.2     ✔ tibble    3.2.1
✔ purrr     1.0.1     ✔ tidyr     1.3.0
── Conflicts ────────────────────────────────────────── tidyverse_conflicts() ──
✖ dplyr::filter() masks stats::filter()
✖ dplyr::lag()    masks stats::lag()
ℹ Use the conflicted package (<http://conflicted.r-lib.org/>) to force all conflicts to become errors
TEDS_2016 %>%count(PartyID) %>%mutate(perc = n /nrow(TEDS_2016)) -> T2ggplot(T2, aes(x =reorder(PartyID, -perc),y = perc,fill=PartyID)) +geom_bar(stat ="identity") +ylab("Party Support (%)") +xlab("Taiwan Political Parties") +theme_bw() +scale_fill_manual(values=c("steel blue","forestgreen","khaki1","orange","goldenrod","yellow","grey"))
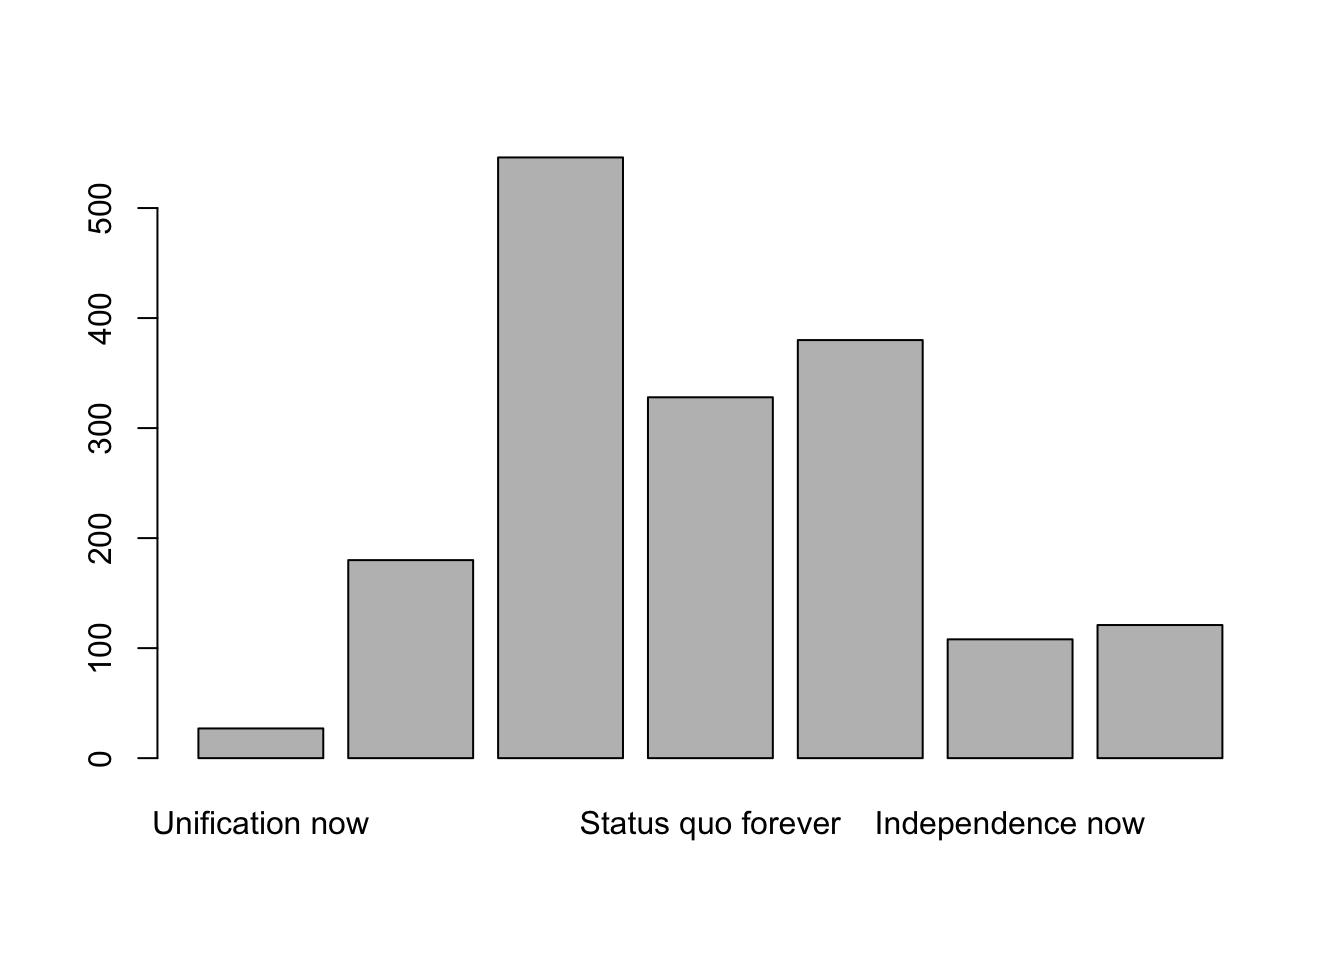
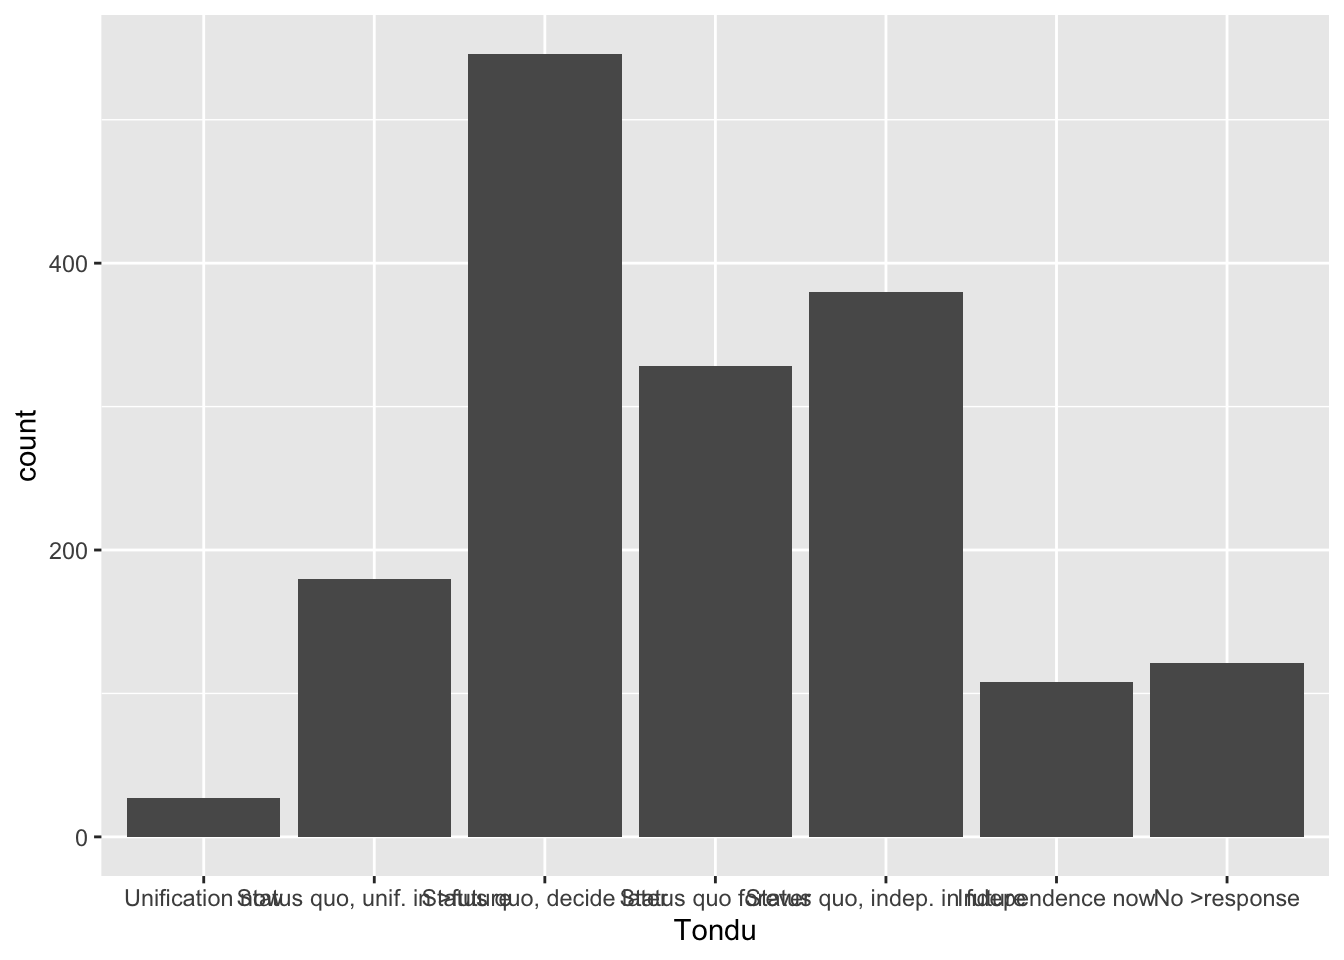
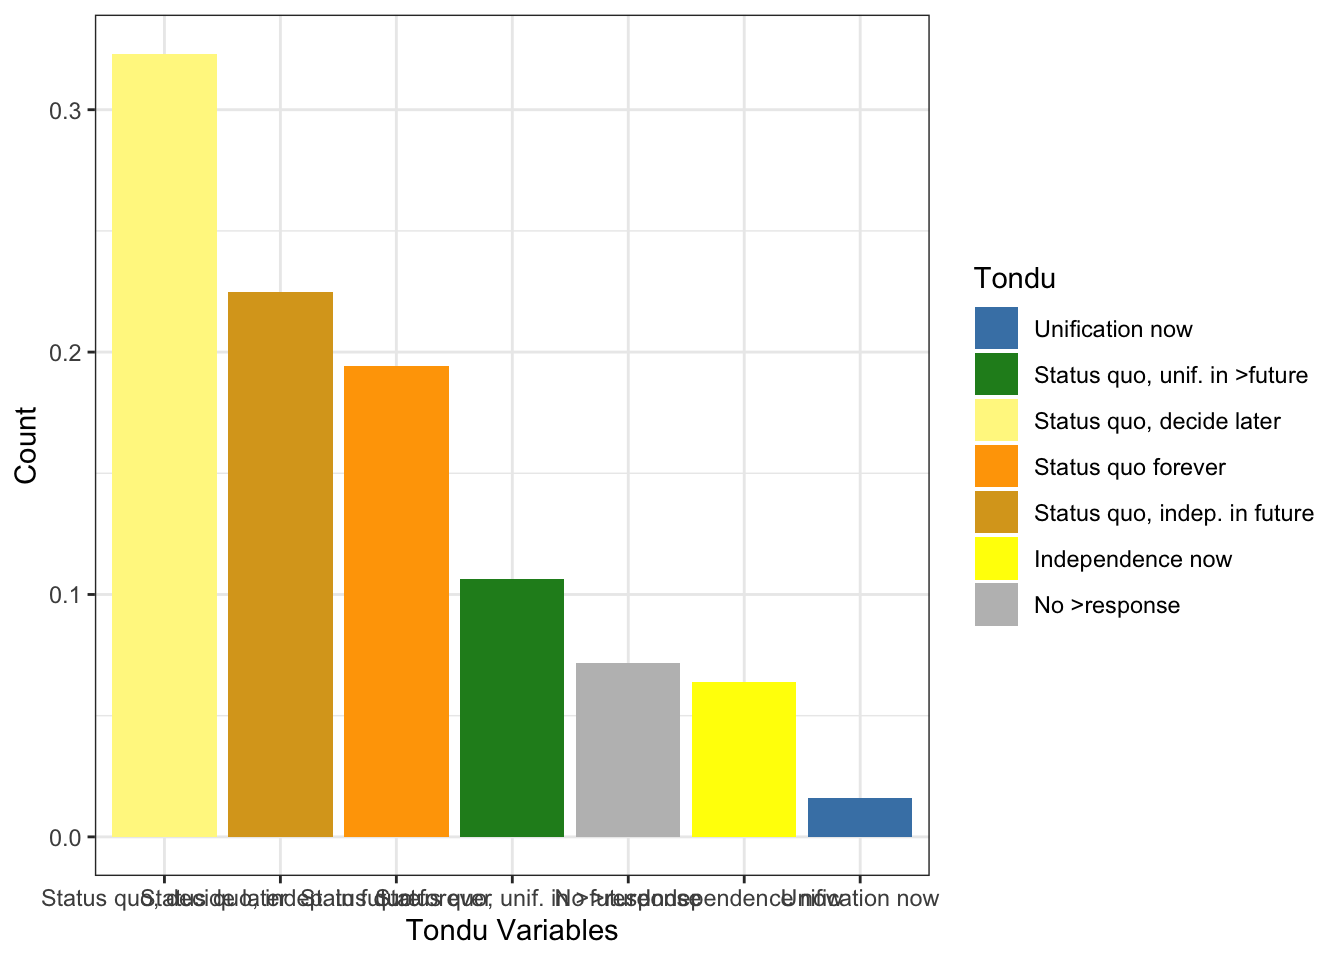
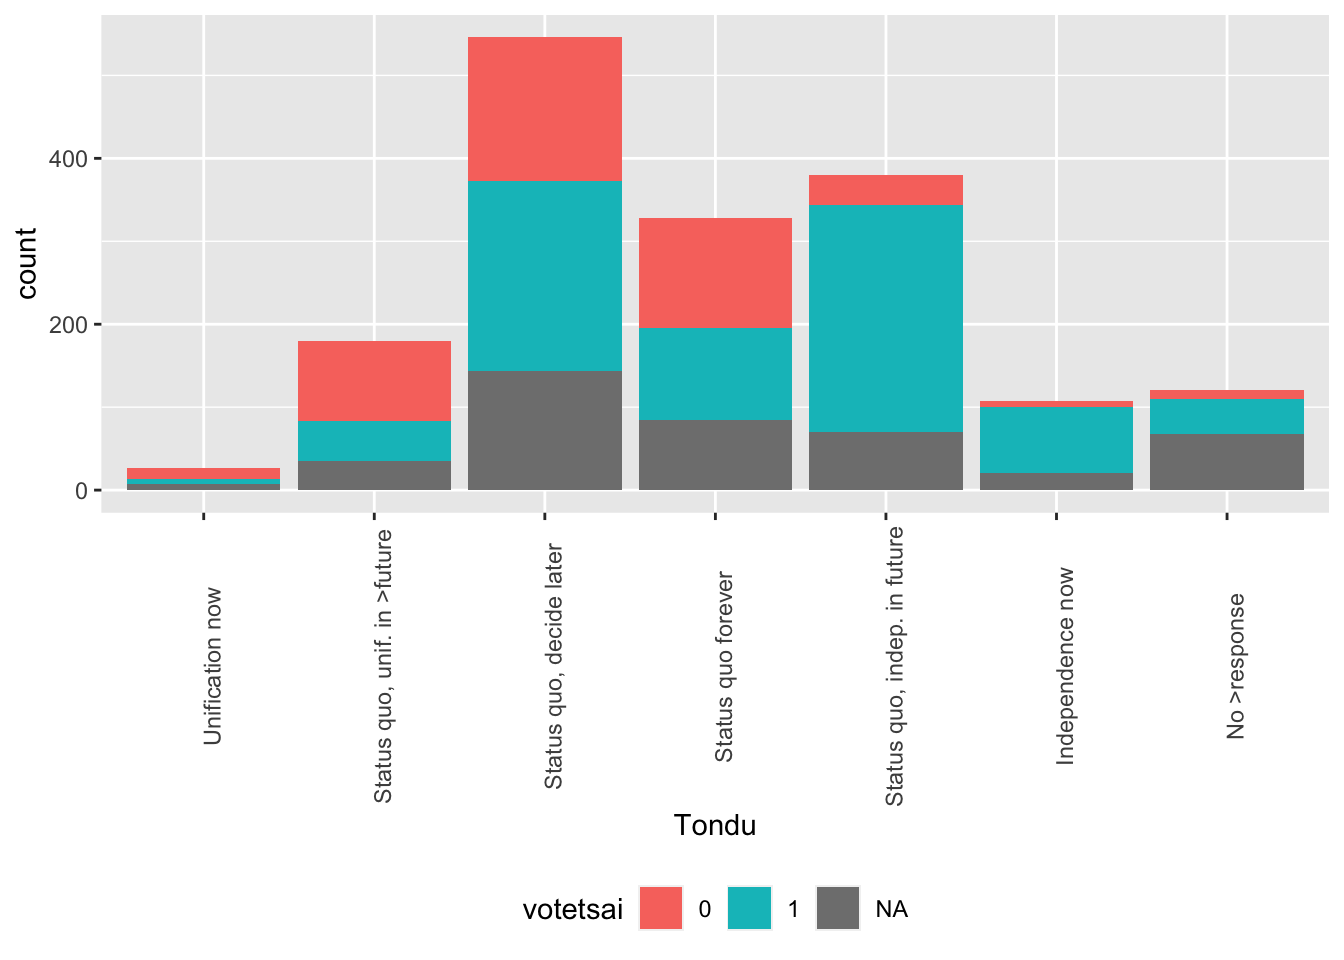
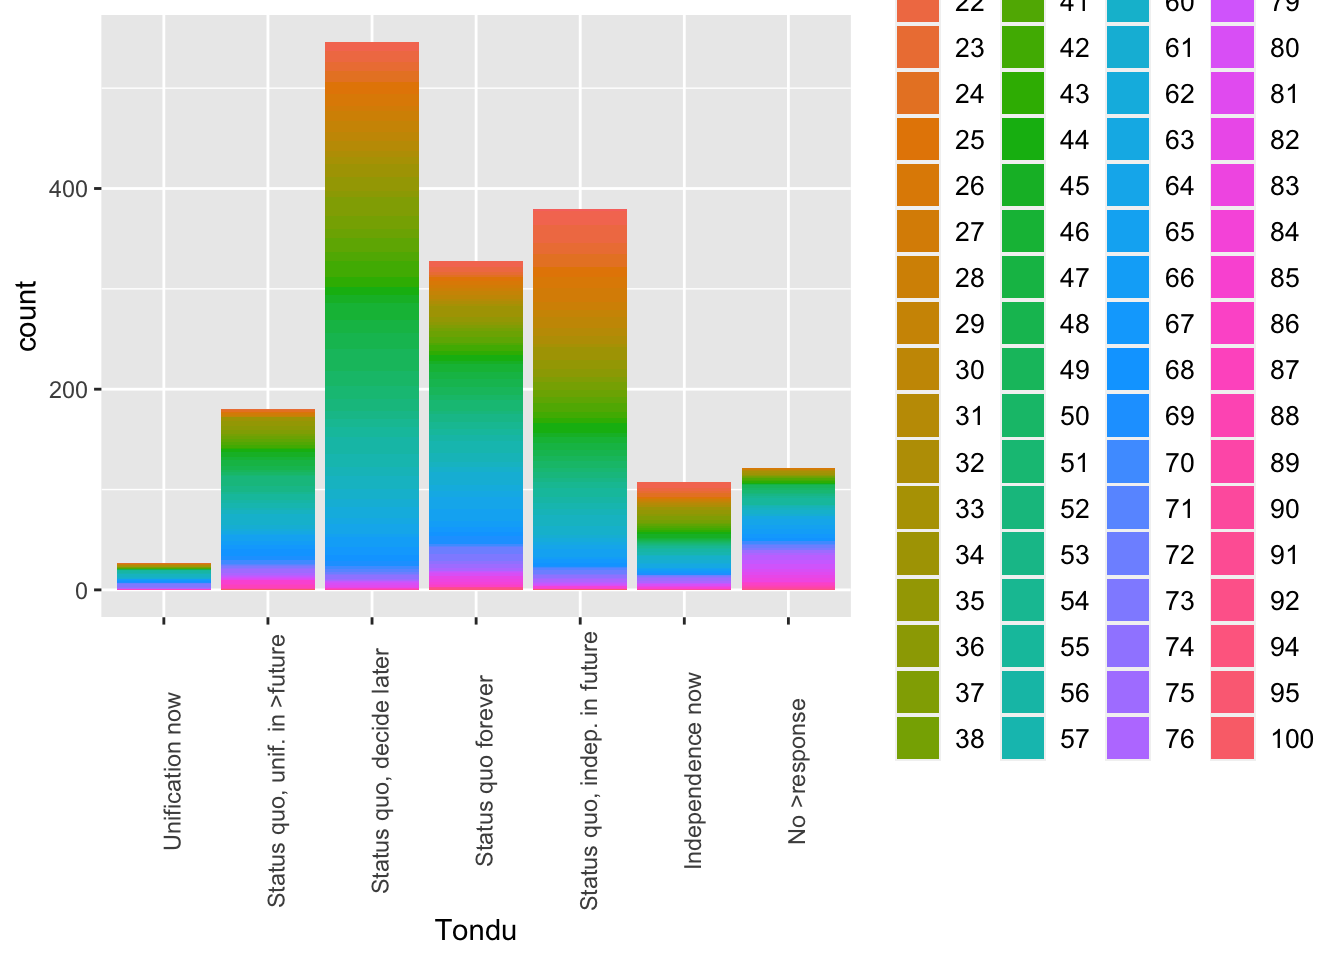
TEDS_2016$Tondu<-factor(TEDS_2016$Tondu,labels=c("Unification now","Status quo, unif. in >future","Status quo, decide later","Status quo forever", "Status quo, indep. in future", "Independence now","No >response"))library(descr)freq(TEDS_2016$Tondu)
TEDS_2016$Tondu
                             Frequency Percent
Unification now                     27   1.598
Status quo, unif. in >future       180  10.651
Status quo, decide later           546  32.308
Status quo forever                 328  19.408
Status quo, indep. in future       380  22.485
Independence now                   108   6.391
No >response                       121   7.160
Total                             1690 100.000